
Safety Sessions
Links to Safety Seminars and Videos
→ Density Altitude (DA)-FAAST Time: 2:21
→ Density Altitude (DA)-AOPA “The Triple H Effect” Time: 4:22
→ Id Div of Aero-Johnson Creek-Safety and SOP Video Time: 6:29
→ Id Div of Aero-Garden Valley-Safety and SOP Video Time: 5:03
→ Id Div of Aero-Stanley-Safety and SOP Video Time: 6:51
→ Attendance at the Annual “Safety Stand Down” Presented by Id Div of Aero
→ Amy Hoover & Dick Williams-Backcountry Discussion– Video Below  Time: 20:19
Idaho Division Of Aeronautics Standard Operating Procedures (SOPs)
KOCH CHART
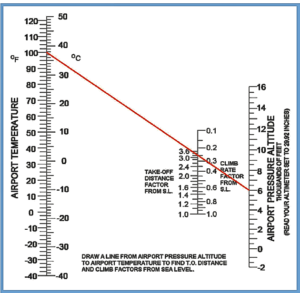
The Koch Chart is used to calculate the takeoff distance factor and climb rate factor based on airport temperature and pressure altitude. The red line, connecting an airport temperature of 100°F with a pressure altitude of 6,000 feet, passes through a takeoff distanc factor of 3.2 and a climb rate factor of 0.25. This means the takeoffroll will require 3.2 times the runway length needed at sea level, and the climb rate will be only 0.25 of that at sea level, assuming standard atmospheric conditions.
DENSITY ALTITUDE CHART
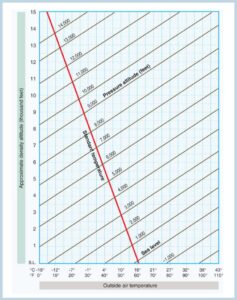
To use the Density Altitude Chart, locate the outside air temperature on the bottom axis and the pressure altitude on the side axis. Draw a line connecting the two values, and where they intersect, read the approximate density altitude (in thousands of feet). This value indicates how the aircraft will perform as if it were operating at that altitude under standard conditions.